 Subscribe
 Members
Rare Earths
The rare-earth elements (REE) are a group of 17 elements on the periodic table, consisting of the lanthanoid series, and scandium and yttrium.
While some REEs are not particularly rare in terms of average abundance in the Earth’s crust, they are seldom found in concentrations high enough for economic extraction, and global annual production is notably low in comparison to many other metals. Nevertheless, the use of REEs in materials and components have enabled numerous industrial processes and technologies, including those essential to clean-energy initiatives worldwide, and to miniaturised electronics and devices.
Figure 1 shows the REEs on the periodic table of elements.
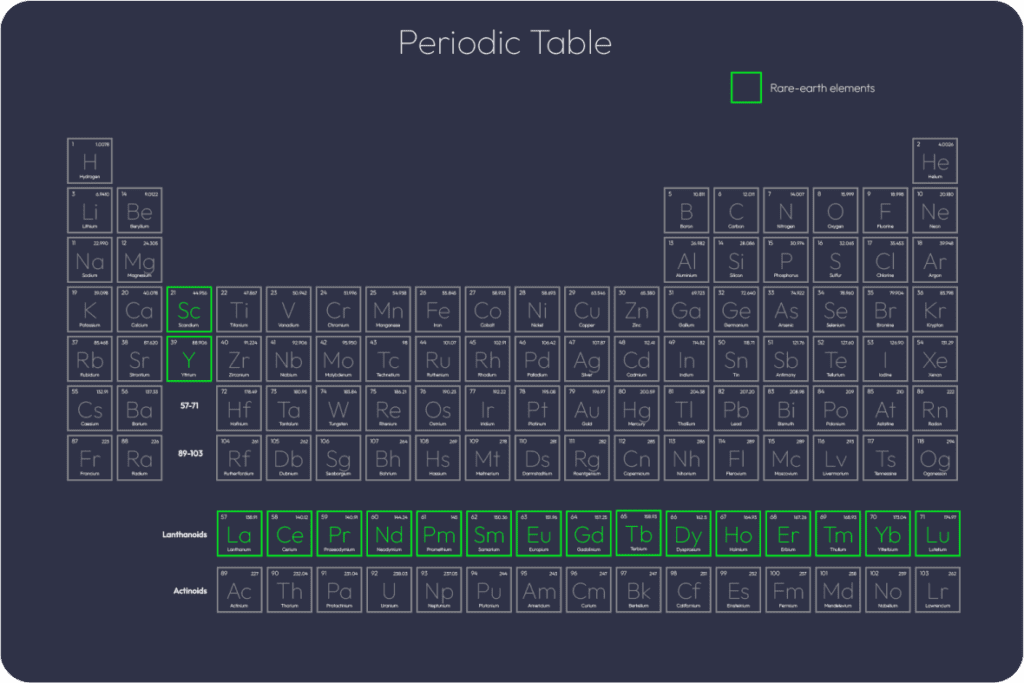
Figure 1: The rare-earth elements.
Terminology
Yttrium (Y) is classified as a REE because of its similar ionic radius to the lanthanoids, and similar chemical properties. Although Scandium (Sc) is classified as a REE, and on occasion concentrates into some of the same minerals as the other REEs, its chemical properties are distinct from the other REEs.
HREEs have at least one pair of 4f electrons — a clockwise and counter-clockwise spinning electron. The physical properties and chemical reactivity of Y resemble those of other HREEs, thus it is considered to be a HREE. Sc is not classified as either a LREE or HREE.
Figure 2 shows the classification of REEs into the aforementioned groups.
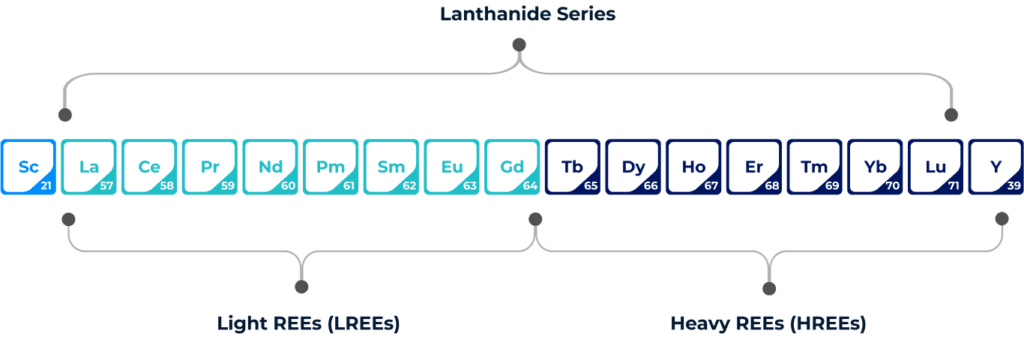
Figure 2: Rare-earth elements include the lanthanoid series plus scandium and yttrium.
Why ‘Rare’ Earth?
Despite the name, some of the REEs are anything but rare in terms of average crustal abundance. The modern use of the name speaks more to the fact that these elements are rarely concentrated into economically significant deposits for extraction and processing, owing to certain physical and chemical characteristics that promote their broad dissipation in most rock types.
Cerium (Ce) is more abundant in the earth’s crust than copper (Cu); neodymium (Nd), La and Y are more abundant than lead (Pb); and praseodymium (Pr), samarium (Sm) and gadolinium (Gd) are more abundant than tin (Sn). However, there were approximately 280 kt of total REOs (TREOs) produced globally in 2022 versus 25.7 Mt of Cu, 12 Mt of zinc (Zn), 11.5 Mt of Pb and 363 kt of Sn in the same year. Figure 2 shows the comparative average crustal abundance and recent global production of these metals.
Figure 3: Average crustal abundance and annual production of rare-earth elements and other metals. Source: Argus Media.
China’s dominance of REE supply is out of proportion to its share of estimated global resources. As shown in Figure 4, China accounts for an estimated 31% of global reserves, but there are significant estimated reserves of REEs in Vietnam (16%), Brazil (15%), Russia (15%) and Canada (11%). There are also important deposits in Australia, Africa, the USA and Greenland, among others.
Figure 4: Estimated rare-earth reserves. Sources: US Geological Survey and Argus Media.
Market Drivers
Vehicle electrification and the energy transition are driving the REE market, and in particular for Nd, Pr, dysprosium (Dy) and terbium (Tb), using in REE permanent magnets (REPMs).
Conventional internal-combustion-engine vehicles (ICEVs) already contain numerous REPMs in applications ranging from heating, ventilation and air-conditioning systems, through to window and door controls, to entertainment systems.
Electric vehicles (EVs) have all of the REPMs seen in ICEVs, but also have much larger magnets for the electric drive motor. A plug-in hybrid EV contains 2-3 times more REPMs by mass than an ICEV, while a full battery EV contains 3-4 times more.

Conventional wind turbines use a gearbox, which connects the blades to the generator and is one way to increase blade rotation speed in order to generate electricity in low to moderate wind speeds. Direct-drive turbines do not use a gearbox and are more reliable and cheaper to maintain. In addition, they provide better yield, especially in light winds, and are expected to become the technology of choice for offshore wind systems.
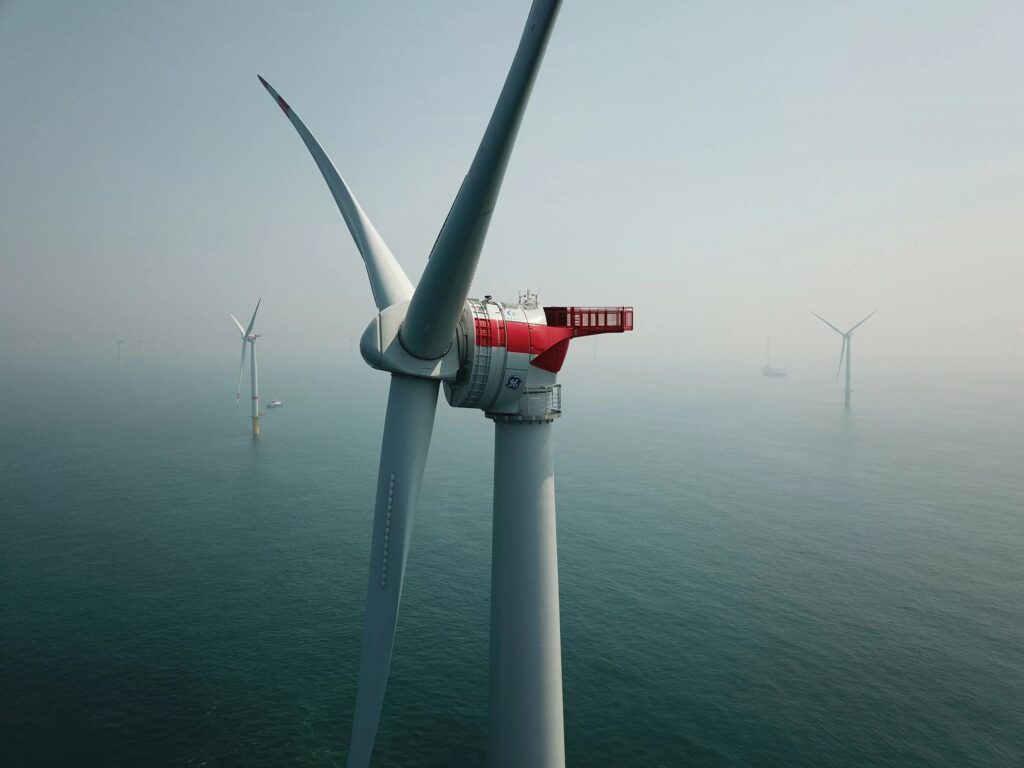
Direct-drive wind turbine generators typically use 0.5-0.6 t of REPMs per MW of generation capacity, and the offshore wind-turbine market is forecast to grow at close to 25% per annum to 2030.
Figure 5 shows the various steps typically associated with the production of REPMs.
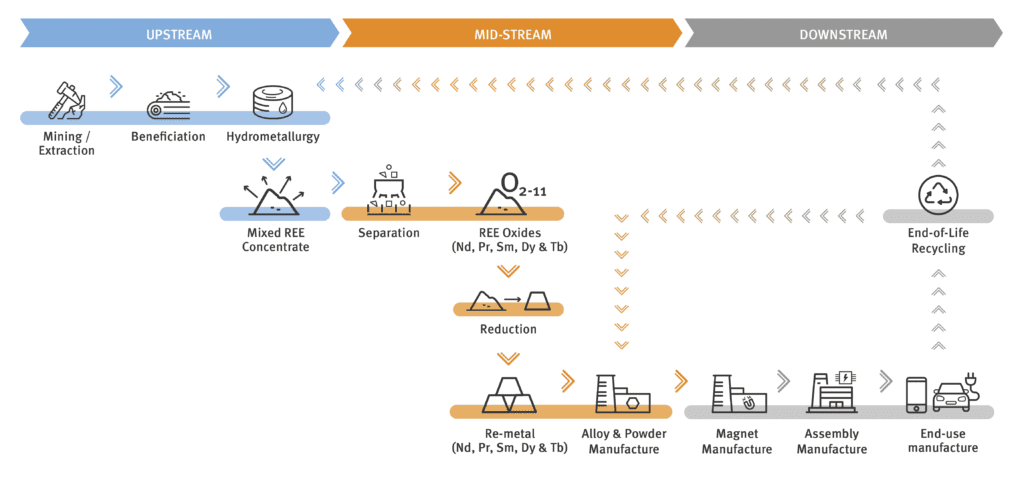
Figure 5: The rare-earth permanent-magnet supply chain. Source: Argus Media.
Rare-Earth Demand
The REPM industry overtook the glass sector as the largest share of REE demand by volume in 2022, representing 26% by Argus Media estimates (see Figure 6). REPM applications accounted for almost 75% of the market by value. By 2033, REPMs are forecast to represent 43% of the volume and 90% of the value of the REE market.
Figure 6: Rare-earth demand by application in 2022 (estimated) & 2033 (projected). Source: Argus Media.
Ce and La still dominate the REE market by volume, accounting for 60% in 2022 (see Figure 7), while REPM materials (Nd, Pr, Dy and Tb) represented 30%. By value, REPM materials accounted for a 96% market share, with Ce and La representing only 2%. By 2033, REPM materials are forecast to reach a 50% share of market volume.
Figure 7: Rare-earth demand by element in 2022 (estimated) & 2033 (projected). Source: Argus Media.
Per Figure 8, total REE demand is forecast to increase steadily at 4%/year to close to 250 kt of REO by 2028, and then by just under 4%/year to almost 300 kt by 2033. Growth in demand for REEs in REPMs is expected at nearly 4%/year to 2033.
Figure 8: Forecast rare-earth demand. Source: Argus Media.
Rare-Earth Supply
Per Figure 8, China dominates the supply of REEs at the mine level with approximately 75% of annual global output, but even more so in terms of separated REEs, where it represents approximately 90% of global output. Chinese authorities increased the REE production quota by 20% in 2021, 25% in 2022, and by a further 14% in 2023, all to supply burgeoning demand in the EV and offshore-wind sectors.
MP Materials has quickly expanded production in the USA, since it re-opened the Mountain Pass mine in California in 2018, and North America (specifically the USA) now represents approximately 15% of world production. The company has commissioned separation facilities at the site and began production of Nd-Pr oxide in the third quarter of 2023.
Australia is another major producer of REEs through Lynas Resources at Mt Weld (with separation taking place in Malaysia) and Iluka Resources from its mineral-sands operations at Eneabba. Both operations are located in Western Australia.
Myanmar has emerged as a key supplier of HREE ion-adsorption concentrates to separation facilities in China. These come mainly from artisanal-type operations.
Figure 8: Rare-earth mine production and separation capacity. Source: Argus Media.
Per Figure 9, REE supply is forecast to increase at a compound annual growth rate (CAGR) of 6%, from 280 kt of REO in 2022, to more than 390 kt in 2028, and then at just over 1% CAGR to well over 400 kt by 2033. New projects are forecast to provide 20% of supply by 2033.
The forecasted increase in REE supply in the next decade will only serve to expand the surplus of Ce and La, while struggling to satisfy growing demand for REPM materials.
Figure 9: Forecast rare-earth supply. Source: Argus Media.